Turning tables with data....
In this post I am going to use a very basic example how to use the data to answer business questions.
Let's say that a savvy restaurant owner hired you as a data consultant to provide some insights about his business. The dataset he has is an excel file with columns of bill totals, tips, day of the week, gender of his customers and the meal (lunch or dinner). This dataset is used as an example in the Python for Data Analysis book which I highly recommend if you want to learn how to use Python Pandas to process datasets. This restaurant dataset is limited in terms of size (only 244 rows) but we will use it for demonstration purposes. You can download this dataset along with my results here.
With the data in hand you do some basic calculations (of course in real life you would spend much time cleaning and munging):
Next step is to start pivoting the dataset to look for possible differences in customer's behaviour.
Let's see how the bill differed between smokers or non-smokers. You can see that the average bill for non-smokers was $19.18 and the average bill for smokers was $20.75. On average the smokers did not leave a higher tip ($3.00) than non smokers ($2.99) did. This is actually something that the business owner is not interested in, but you can pass your insight onto the waiters.
Just after your first 5 minutes with the dataset the business owner asks you an important for him question.
"I have a hunch that the men spend more than the women. I am thinking about changing my place to a sports bar. You are the genie, tell me what to do..."
You start looking into the data. In total the men spent $3256 and the women $1570. But in the dataaset there were only 87 women tables while men tables were 157. On average the men spent $20.74 per table and the women $18.05. Is this enough evidence to support a massive investment from the business owner? No...
Then you start thinking like a data scientist. You split your data between men and women tables. You create a model predicting the total bill for a male table based on the rest of the variables(smokers or non, day of the week, dinner or lunch and party size). In our case every data input is categorical so our life is much more easier in model creation (this is not the case everytime).
I used multivariate linear regression to create my male based model and then I fed this model with the data from the female table dataset. The whole purpose of it was to simulate the case where all the customers were men and to extrapolate the total revenue for the restaurant.
To answer such a business question split your data in clusters, build a model with the cluster you want to simulate and then feed this model with the rest of the data. This way you can answer A/B scenarios for the business. The predictive accuracy of your answers is analogous to the accuracy of your model. In our case we achieved a mean average percentage error of 25 which is on the higher end of the possible accepted values. Of course we informed the business owner about this limitation and that we need probably more data before we can give a more plausible answer.
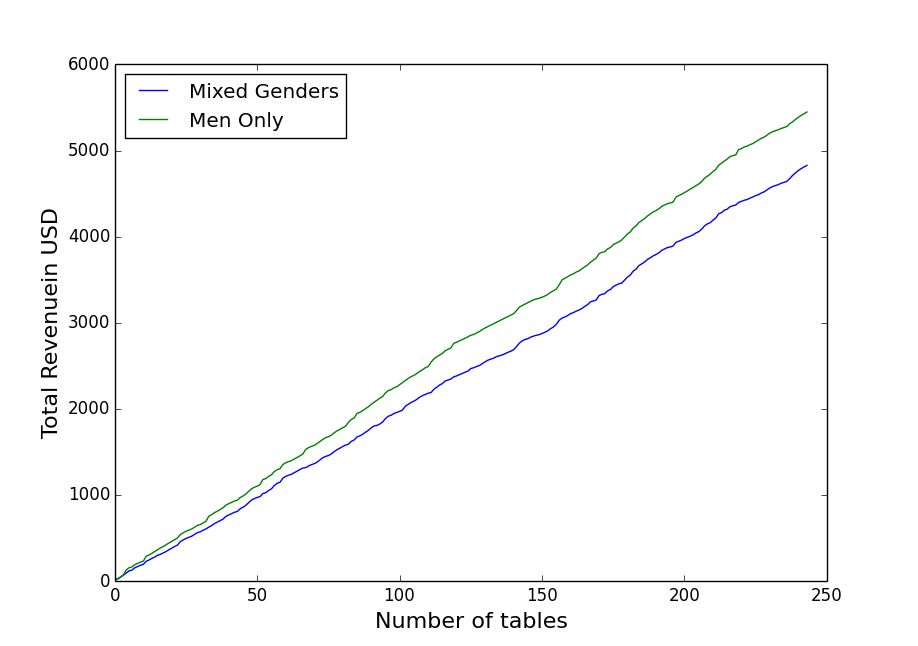
So the current business model with mixed gender tables created a revenue of $4827. According to our extrapolation if the restaurant had only male customers it would have generated an extra revenue of $620 giving in total $5447. See the graph below.
You present your case to the business owner with your graph and you tell him that the average bill per table now is $19.78. Switching it to a sports bar you would increase the average bill to $22.32 per table. On this happy occasion also you present him the $1000 bill for your services....
Of course you can use this technique to answer all similar type of questions e.g. "would my revenue increase if I had a non smoking policy?", "what would my revenue be if I only accepted 4 persons per table minimum" etc. This technique is a very powerful way to interrogate your data and answer business questions. I hope with this simple example you got the whole concept and how it can be used for your own datasets!


comments powered by Disqus