Multivariate Regression Scripts for Octave:
Predictions from a series of data
Say that you have a series of data. For example you have a spreadsheet that has many variables (numeric) and an end result. It can be for example a spreadsheet of observations from your restaurant where you write down how many people were dining on the table, how much money they paid, the time they spend at the table (in minutes), how many courses they had and then the final column would be the tip they left.
You are a poor waiter trying to pay off your student loan. How would you predict what tip the next customer will leave?
Of course by using my script to create a cell in your spreadsheet that would predict the future tips per customer. Cool eh?
GNU Octave is an excellent package (in a nutshell it is an open source matlab) with excellent vectorised libraries that will make your life very easy when it comes to matrix manipulation. Machine learning is all about matrix manipulation. Octave is an excellent tool for testing your machine learning algorithms with your data so that you can prototype fast before scaling up. It is also used in Machine Learning Coursera Class from Andrew Ng, which I definitely recommend.
Let's see a real example of implementing machine learning to predict future energy production from photovoltaic cells. I used this script when I took part in Cambridge Energy Challenge.
You can clone the script and the files that are needed to run your own predictions from your spreadsheets (csv format) in my github repo here.
So let's see this script in action. Presumably you have installed Octave in your system, cloned the script in your laptop, started octave and navigated to the script's directory. In this directory you should also have your spreadsheet. An example spreadsheet of the energy challenge is included in my github repo. At this point you are ready to invoke the script by just typing:
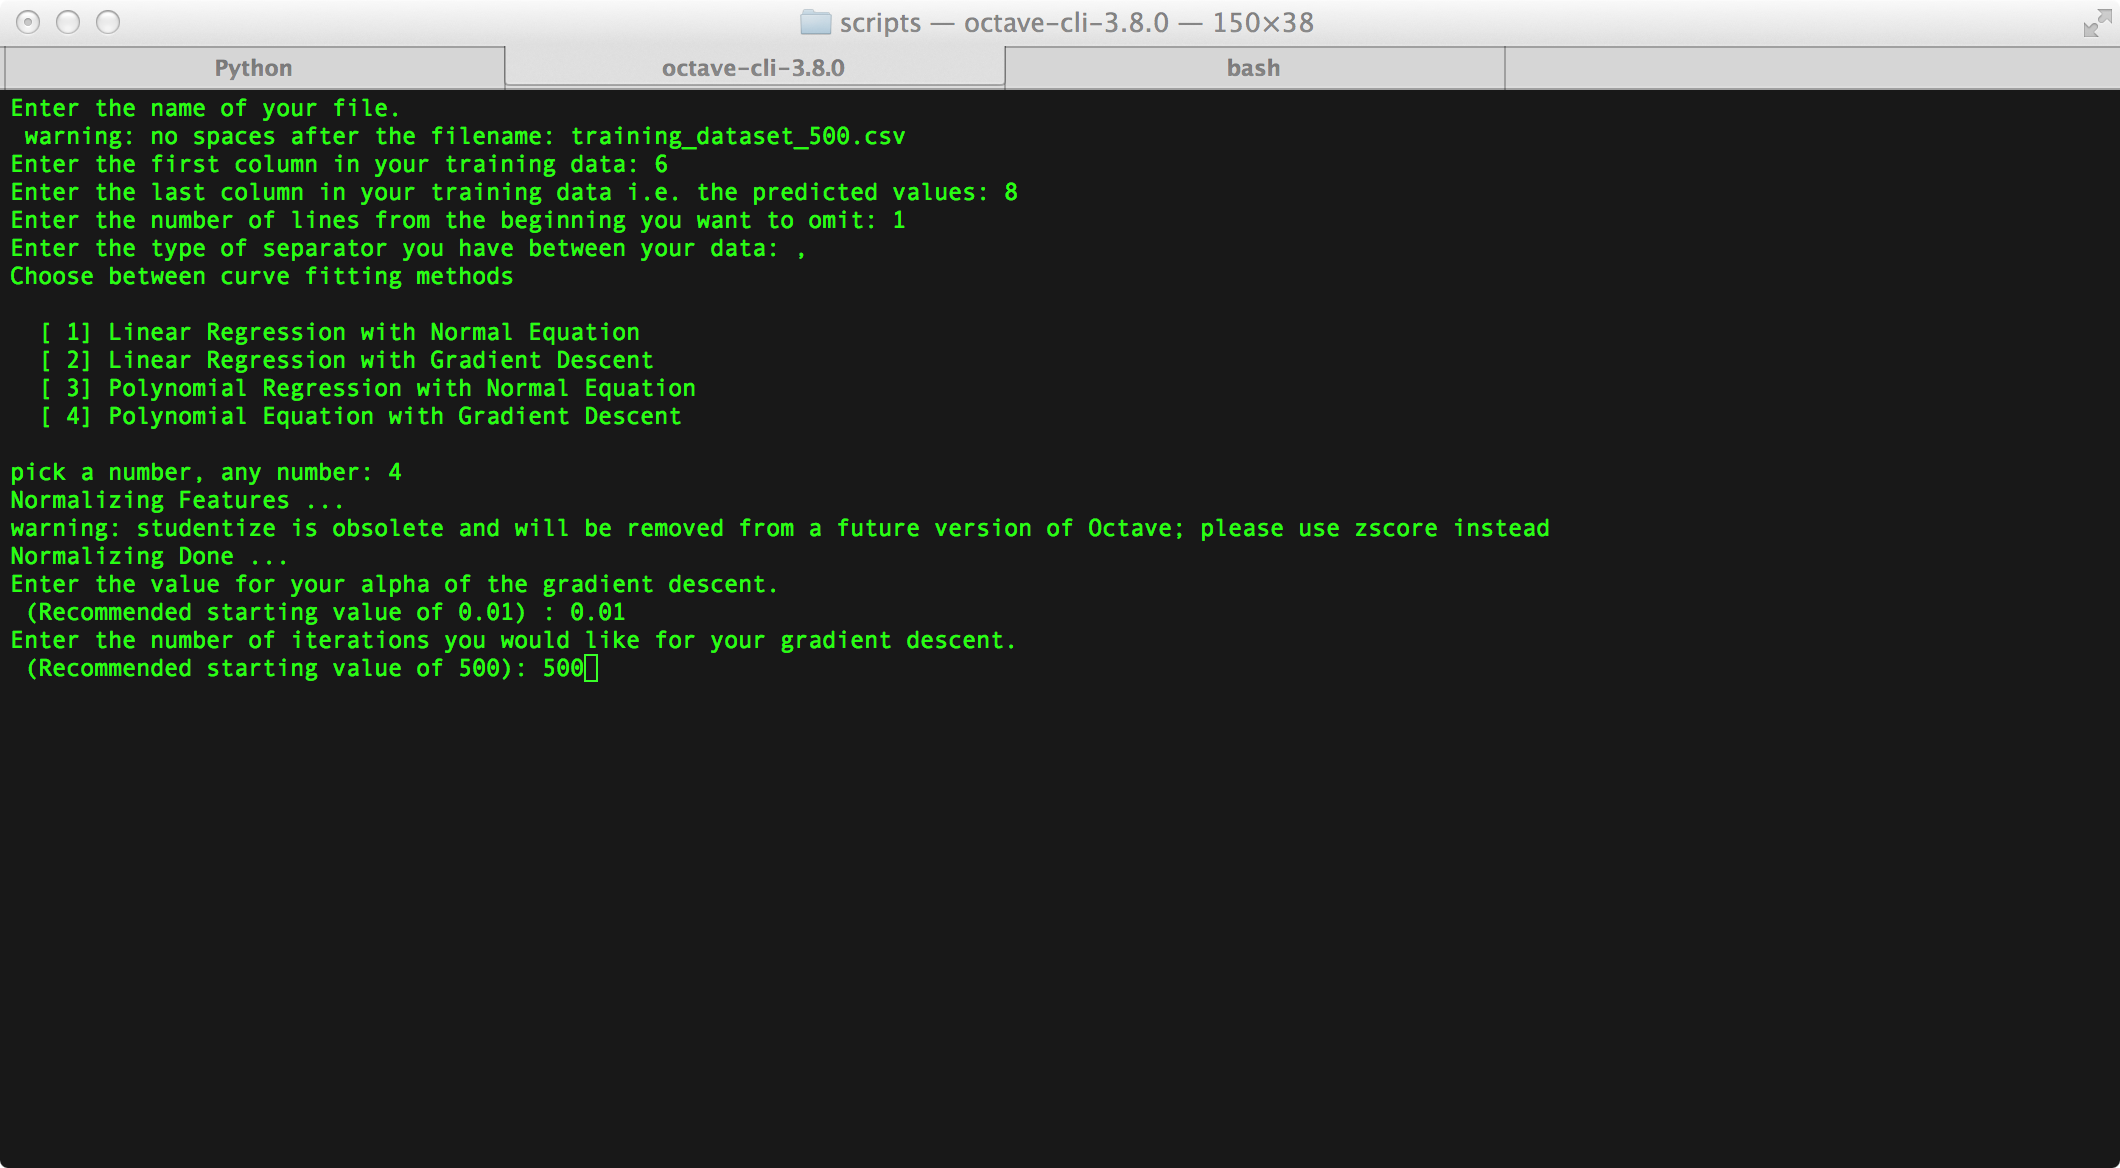
>> machinelearningscriptin Octave workspace. You will be asked to enter the name of the file. For our example just type training_dataset_500.csv Take care not to include spaces after the end of the filename and press enter.
You will be asked to enter the first column of interest in your training data which in our case it is the 6th column, so enter 6. You will be asked to enter the need to be predicted values column which is the 8th, so type 8. Then you will be asked to omit lines from the beginning which is often the case with spreadsheet files, in our case enter 1. Then you will be asked about the separator in your data which in our case is comma so enter "," (without quotes).
After all these preparatory steps you will be asked to enter your curve fitting method of choice. Choose the 4th for our case. There is a huge discussion which method you should choose but the 4th is a good choice in the case you have many variables.
You will then be asked for the alpha value for the gradient descent and I would recommend you start with 0.01. If this is not good enough iterate with bigger values I would say 0.1, 0.3, 1, 3 etc. Alpha is else known as the learning rate.
You will be then asked for the number of iterations of gradient descent. I would suggest at least 500 for starters. If everything goes well you should be seeing the image below in your screen before you press enter.
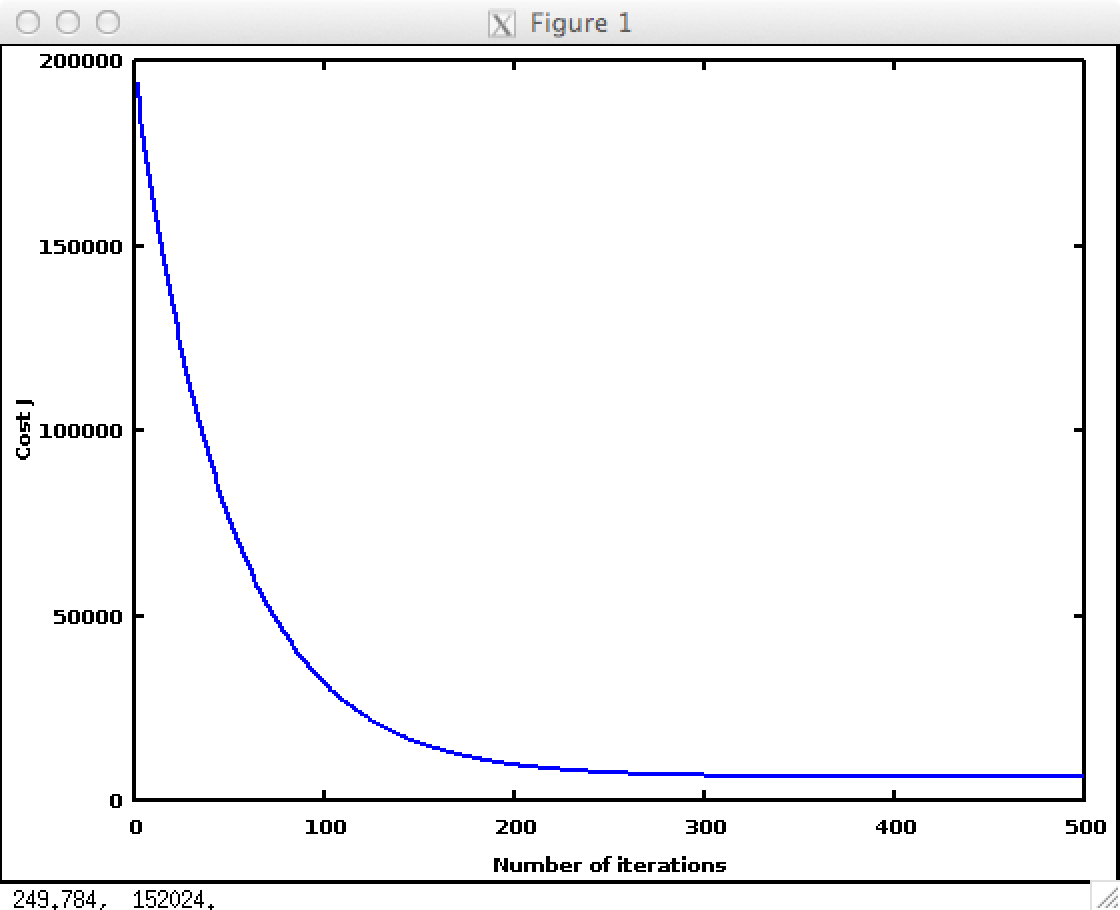
Just press enter and the magic takes place....You should see an image like below for the learning curve to know that the learning has been optimised and you have reached convergence.
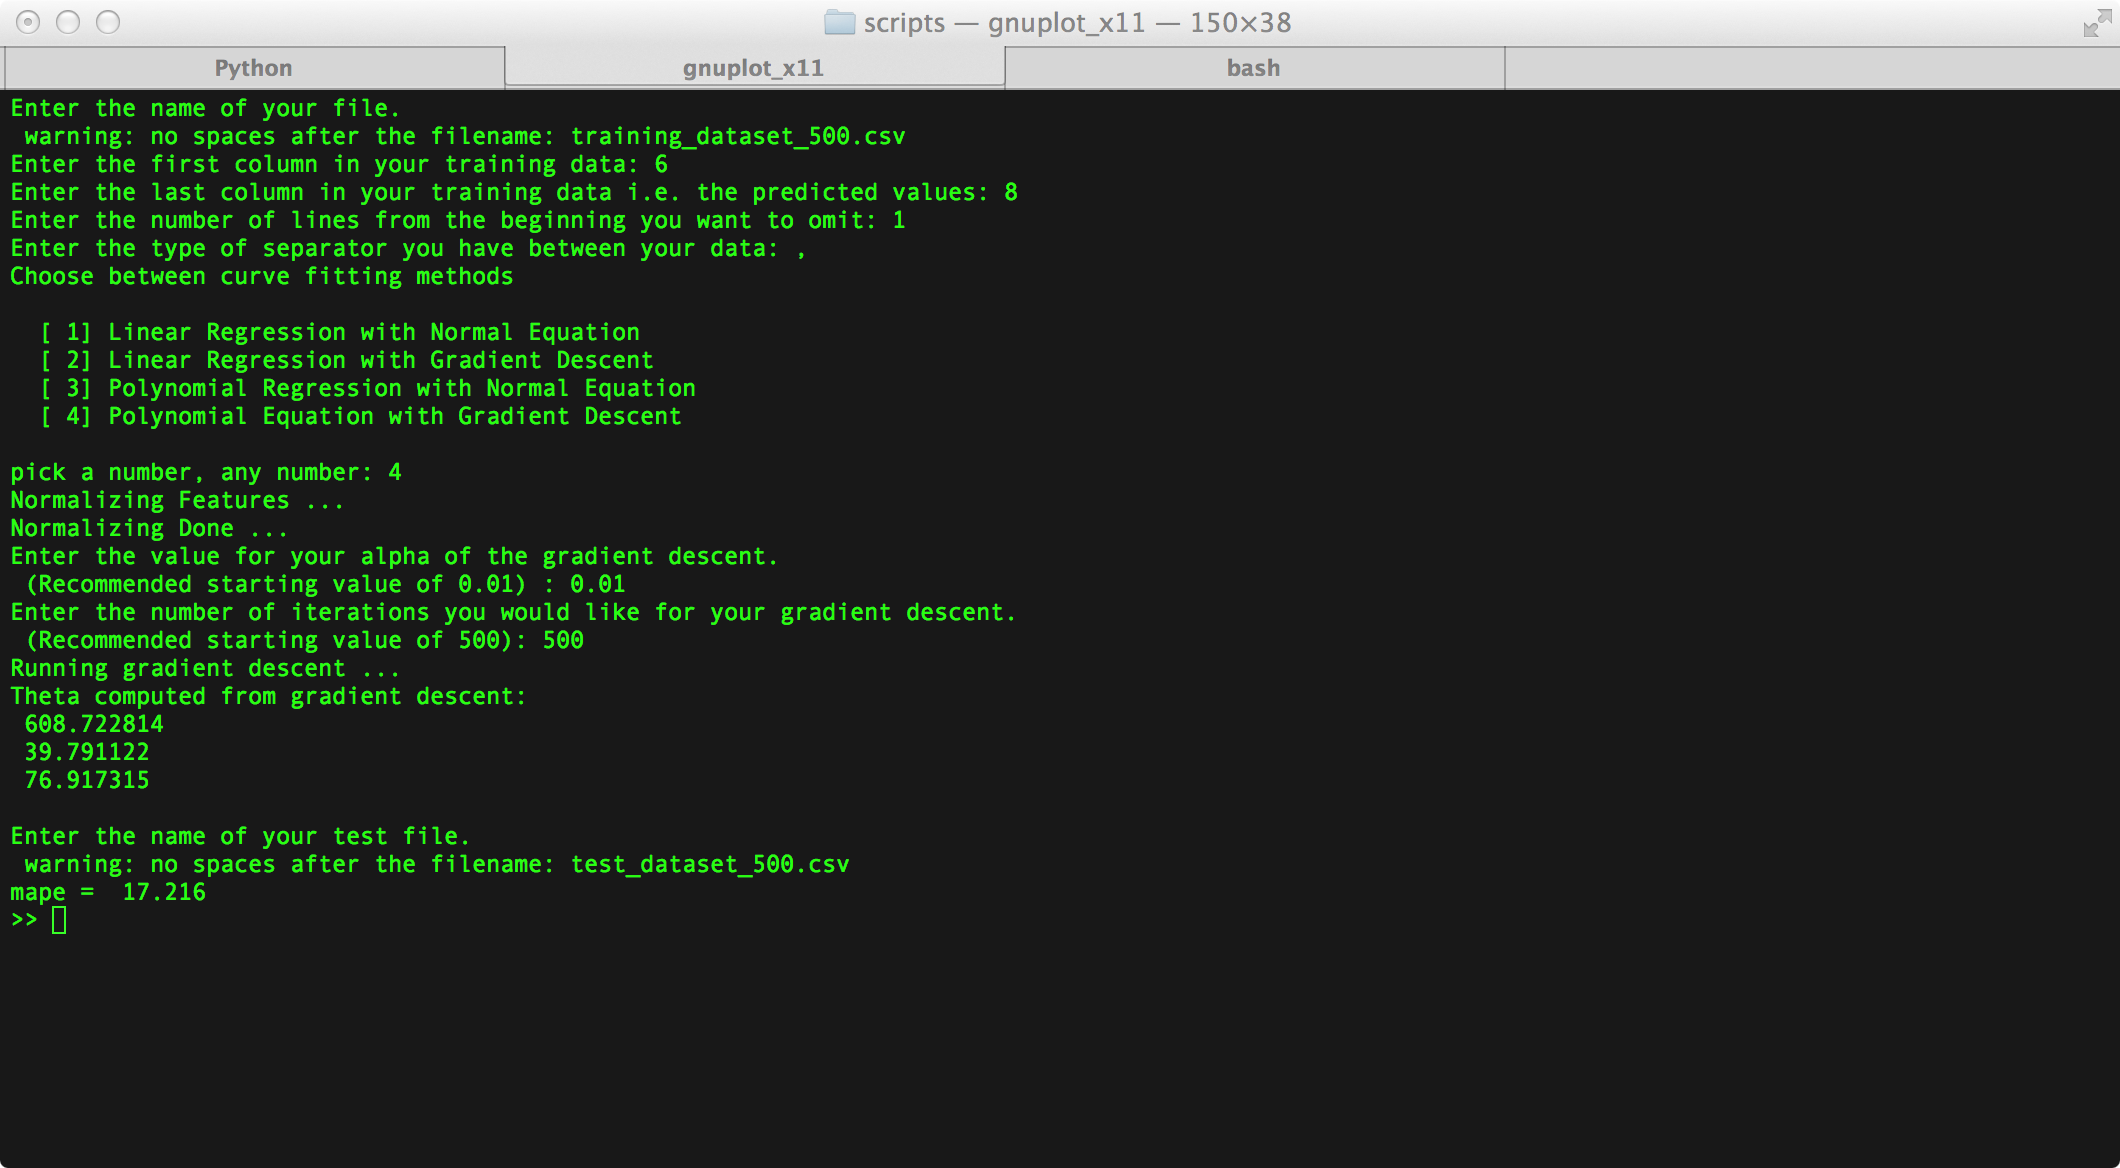
What you will also be getting as a result will be your thetas!!! Thetas are the essence of your predictions. Thetas are the coefficients in an equation that produces your predictions so if you want to predict new prices just calculate that equation and voila! Power of prediction in your hands. The equation is of the form:
 predicted value = theta0 + theta1 * value1_of_your_model + theta2 * (value_2_of_your_model)^2 +
 + theta3 * (value3_of_your_model)^3 + ... + theta_n * (value_n_of_your_model)^n
But how good would these predictions be? You need to estimate the error of your predictions. A good measure of this error is the MAPE (mean absolute percentage error). Risking oversimplication here I would say that a mape round 15-ish would be alright. In order to get this MAPE you would need to have another file which should be a part of your original spreadsheet's data. This is because you cannot see how good your predictions are in the dataset you used to train your model. You need new data to test your model. A good rule of thumb is to split your spreadsheet data in two parts: 75% for training and 25% for testing. You will be asked by the script to enter the filename of the spreadsheet with the 25% of your data (not the ones you used for training). For our example it is test_dataset_500.csv. Again take care not to have any spaces after the file name. If everything goes well this will be the end result screen.
Have questions? Need some help? Need a machine learning algorithm implementation in your data? Just send me a message and we could talk. I live for data and the potential applications of them!!!


comments powered by Disqus